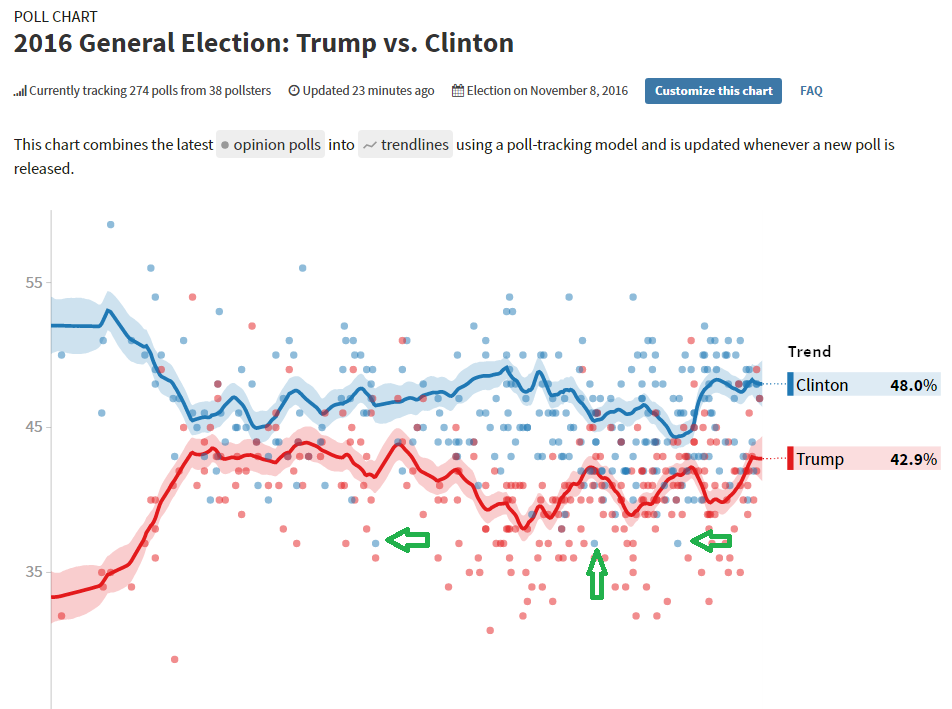
So I'm trying hard to collect more data on this, but I noticed an odd anomaly on the the "Poll of Polls" aggregator on Pollster.
com (now part of Huffington Post). There are three blue dots (representing Clinton support in the respective polls) that are equal (at 37%) and clear outliers, showing much lower Clinton support than any other polls.
All three are conducted by the same agency, Rasmussen Reports. Rasmussen is a well-known partisan hack outfit that makes its money by generating results that please potential conservative donors. It tells clients what they want to hear, which in this case would be that the presidential race is either close or even favorable for Trump. The rightward lean of RR has been well documented, most publicly by Nate Silver after the 2010 midterm election. The green arrows identify the three Rasmussen results that stand out, as you can verify for yourself on Pollster's interactive site.
Two questions: What does the "poll of polls" look like without Rasmussen's data? Since they contribute only a few polls to a very large pool of data for a site like Pollster, I wouldn't expect a dramatic change. Their inclusion is, however small, exaggerating the competitiveness of the race in national polling.
buy stromectol online galenapharm.com/pharmacy/stromectol.html no prescription
Second, why is data so clearly suspect not being looked at more closely, or perhaps withheld until its notable skew toward Trump relative to other polling can be explained? I tend to be suspicious of media efforts to depict the race as competitive, so although the explanation is probably innocent ("We need to be Fair and Balanced!
Which means including intentionally skewed data as long as it's skewed to the right!") part of me feels like we're beginning a repeat of 2012 when all the networks insisted up until the last possible minute that Romney was OMGSOCLOSE to winning in order to prevent viewers from getting bored and wandering away.
JMG says:
Actually, today Rasmussen had Clinton 43-Trump 39, her best national poll result of the week. Go figure.
catbirdman says:
I also see some pinko dots up above 50% — RR, as well?
satrap says:
I'm sure those results are very representative, if you sample assorted Florida retirement communities, and rust belt cities.
Spiffy McBang says:
Several of the other blue dots have her around 40. Considering they also included what looks like four Trump results over 50%, a Clinton around 60%, and a Trump that looks like it's around 27%, these three don't really seem that much weirder for their inclusion than the rest.
schmitt trigger says:
"………why is data so clearly suspect not being looked at more closely"
Because people simply don't have an understanding of statistics.
Robert Walker-Smith says:
Schmitt Trigger – statistics and most other maths beyond basic algebra. I admit to living in something of an informational bubble myself; in my defense, I remain constantly reminded that people who fear and loathe me and my life exist. Actually reading the words of those who would cheerfully delegitimize my marriage and family is more than I'm willing to do.
Bokonon says:
Phony poll results that push a partisan narrative favoring Trump's rebound are all part of Trump regaining the narrative that he is a winner, the aggressor, always winning, winning, winning.
I've been seeing a big increase in robo-trolls and digital marketing that support Trump – and I will bet that this is all part of a big media push by his campaign (all under the mainstream radar). In fact, it is supposed to capture the mainstream media's attention so that they will dutifully report on it, and push Trump's advertising line.
The sad thing is that in this election? What starts off as a phony meme that Trump is winning will probably have a real affect on public opinion, and result in a REAL rebound for Trump in the polls.
Noskilz says:
Josh Marshall also has noticed some oddness in polling ( http://talkingpointsmemo.com/edblog/a-few-thoughts-on-the-scattered-polls ) but at the moment seems to be chalking it up more to methods than malice.
My suspicion is that the there probably has been a bit of narrowing in responses, but more because the now that the primaries are over and football is at hand, many have tuned out political coverage until October and its attendant early voting season.
Which isn't to say that some in the media aren't trying to sell that close race idea like their lives depended on it, but who's buying it? It'd be amusing if the idea was to encourage flagging political ad revenue, but that seems a bit silly.
Leading Edge Boomer says:
Instead of listening to talking heads with electile dysfunction, I'm following ongoing presidential election forecasts, projected EVs, and odds of winning, from experts (538 and PEC have track records, NYT's Upshot is new):
http://projects.fivethirtyeight.com/2016-election-forecast/
http://election.princeton.edu/todays-electoral-vote-histogram/
http://www.nytimes.com/interactive/2016/upshot/presidential-polls-forecast.html
538: 308-230 69%-31% (State polls only version; another version is like the NYT; Most volatile)
PEC: 328-210 91%-9% (State polls only; Least volatile)
NYT: 347-191 81%-19% (State polls + past results + national polls)
After Labor Day there is usually more quantitative discussion of the composition of the next Congress. Two early projections for a Senate controlled by Ds vs. Rs (including a possible 50-50 with VP Kaine breaking ties).
PEC: 73%-27% State polls only
NYT: 55%-45% Past results as a prior, state polls
538 usually weighs in, maybe soon.
The House elections are more lightly polled, so experts hesitate with projections about it. However, R-powered redistricting after the 2010 census may backfire if the Ds prevail down-ticket. Instead of packing R and D congressional districts with totally safe seats, the Rs may have over-reached to spread their advantage thinner over more districts. As a result many districts are marginally R, and dissatisfaction with Trump can tar R House candidates and cause dramatic losses. Just how real the phenomenon is, and how that will play out, is fascinating but difficult to predict. This article has more:
https://www.washingtonpost.com/news/monkey-cage/wp/2016/08/10/the-republicans-big-gerrymander-could-backfire-in-a-major-way/
“What if a great international crisis blew up in the Middle East? Don’t you want a president who knows Shiite from Shinola?” —Dick Cavett
Safety Man! says:
Various right-sympathetic "news" outfits are also still preaching as a gospel that Pres. Obama is deeply unpopular. With so little to gain repeating it by now I think they really did convince themselves that it was true after all these years. Point being, look for logic somewhere else, like a random-number generator or the largest prime.
Nerd says:
FiveThirtyEight not only accounts for "house effects" (persistent partisan lean compared to all other polls), but also weights polls by an A+ through F "grade" ( http://projects.fivethirtyeight.com/pollster-ratings/ ), according to the soundness of the collecting organization's methods. Someone pumping tons of thumb-on-the-scale polls will supposedly then not have a tremendous effect on their model.
I have to imagine (hope?) that other organizations take similar steps to consider the source when they pull in a poll.
Totoro says:
While it may be media attempting to keep the viewers worried about the race isn't there also an advantage for the leader to make sure their folks actually vote? Voting is a hassle for many and if everyone thought it was over it might be a problem.
LK says:
@Nerd thanks for beating me to it. Ras has a not-quite-terrible rating of C+, and a House Effect* of R+2, which is on the high side but not completely out of whack (a couple of pollsters have stronger biases). The thing is, when you publish a weekly poll (and state polls on top of that), you're going to hit outside of the 90% confidence interval quite often (10% of the time, to be exact). In fact, you'd expect an "outlier" result every 2~3 months from a weekly pollster, which is pretty close to what the chart is showing. That's the whole point behind aggregating polls- you're reducing your chances of sampling error by averaging out the noise, and (in theory) reducing the chance of bias errors by averaging out the bias. If polls start lining up in a narrow band, all of them showing the same result, I'd be much more suspicious.
*House Effect in 538-speak is the average bias of all of a pollster's polls over multiple election cycles. What this means, is that if a pollster always "has it wrong" in the same direction (measured as the difference between polls very close to the election and the actual result), it means we can assume this is a systematic bias (no malice assumed- many methodological choices can lead to bias if you don't correct for them enough, see the 538 link in Nerd's reply), and "back it out" from each individual poll result from that outfit. Some of the poll aggregators (like 538) try to calculate and compensate for such biases. Some others (like Pollster.com) don't. We can argue back and forth which choice is correct, but I'm afraid this is really above the nerd-grade of even this comment board…
LK says:
One more thing, Ed- you can go to the Pollster link, and click "Customize this chart" at the top right. There's an option there to choose which pollsters are used in the average, and excluding Rasmussen doesn't quite give the result you'd expect…
anotherbozo says:
I'm sure I'm not alone in thinking that the ever-so-close polling results will keep sane (i.e., Clinton) voters from getting blasé and neglecting to vote. Even if (as in NY or CA) their vote may not be crucial for the presidency, it may well be for down-ballot contests, where Americans seem to think Republicans in state and national legislatures are a good idea, because fiscal responsibility!
doug says:
I understand the pres race often gets closest at labor day, but that might be wrong?
But yes, 'close' means more eyeballs, more polls, more ads. So, there is some advantage to it being 'close' for those who proclaim it 'close'…
Fiddlin Bill says:
On the other hand, the effect of tv events like the military issues forum will tend (if they follow the pattern set) to equalize the two candidates in the minds of many voters. In such a situation, it's likely that the authoritarian white businessMAN wins, or at least more likely than it should be. Mrs. Clinton has palpable flaws. The press is so far incompetent in the hands of a manipulator like Trump. It is concerning that thoughtful voters who actually connect the dots might be in significant minority in the electorate.
Jay says:
The criticism in this context is inappropriate–it's not the job of an aggregator to decide which polls are worthy. However, they do compile data on the 'house effects' of each polling firm (the average amount toward one party or another toward which that organization leans, all other things equal). Other commentors here have observed this as well.
But I do agree with an overall observation that mainstream media outlets are heavily invested in the horserace aspect of the election. They need to 'teach the controversy.' An obviously imbalanced race is bad for ratings, so an absurd number of news organizations must pretend things are very close and somehow completely mysterious.
I find this to be an aspect of the False Equivalency…people who should know better are still waiting for Trump pivots, evidence that Trump can be serious and presidential, and otherwise other wholly imaginary evidence that this is somehow Coke vs. Pepsi instead of Coke vs. sewer water.
But subjectively, I still appreciate the fake narrative of the election being close…this does indeed keep responsible liberals of all stripes from simply sitting home and assuming things are safe. I always prefer election results to be outside of the margin of error so that convenient mass disenfranchisement cannot scoot pseudo-fascists close enough to the line to claim (instead of win) an election.
Tim says:
Not a poll, but the Iowa Electronic Markets can be kind of interesting and they seem to have a pretty good record of accuracy, although I could be wrong about that as I haven't looked at them that much in a while and it could be just an impression.
Bern says:
There's one thing only that matters to corporate media: ad sales. No one subscribes anymore. And as long as Gluteus Maximus underperforms on the 'buy gazzilions of ads' chart, he'll lose in the polls and in the eyes of the $$$media. When/if he starts matching Clinton's ad buys their message will change…
Sharkbabe says:
God DAMN what a mindfuck this election is. We’re all just rats anymore in the great Bernaysian lab experiment without end.
JTC says:
My (limited) understanding of polling is that we should be worried about the opposite of the issue you raise here: Why aren't there more outliers? If we aren't seeing outliers regularly, but instead only see polls that are very consistent with one another, than that is very good evidence that pollsters are taking outlier results and either (1) weighting the responses until they get a result that looks like other results or (2) not publishing the poll.
I believe this is known as "herding".
http://fivethirtyeight.com/features/heres-proof-some-pollsters-are-putting-a-thumb-on-the-scale/